The funding dilemma for early-stage startups has intensified ever since 2022, when the venture capital market became more competitive. For founders to appeal to investors – especially those who are concerned about the recession – they need convincing evidence that their investment will pay off. Quantitative forecasting is one way of achieving this, but with little or no past financial data to support such a forecast, metrics are scarce.
There are ways to build an effective case and overcome the challenge. These steps, if implemented properly, can help to not only create convincing financial projections backed by data, but they also provide the basis for a data-driven strategy that will allow founders to scale their operations.
In 2018, when I moved from the financial sector to consulting, I advised dozens startups about business development and raising funds. Venture capitalists are attracted to big and bold ideas, and they have been focusing on metrics such as cash burn rate and the path to profitability. However, strong revenue forecasts for each year remain important.
Start with a data strategy
Investors will draw a straight line between the topline revenue projections and the value potential of a company, even at the earliest stages. You must show that you will be able generate $100 million per year within five or seven years to make your startup worth $1 billion. You can achieve this in many ways, but the general rule is that the faster your revenue grows, the more valuable you are and the more likely investors will be interested.
To grow rapidly and generate the recurring annual revenue that firms need, they must be flexible. In order to do so, firms must have a data literacy, which means they need to make their operational data easily accessible. Use metrics to set benchmarks for your operation and include them in business plans, financial model and pitch decks.
Although I understand that not every company can afford to produce and research these stats, each startup should create a data analysis and collection function focused on metrics they need most. It is for this reason that I recommend clients start by focusing on three key building blocks.
-
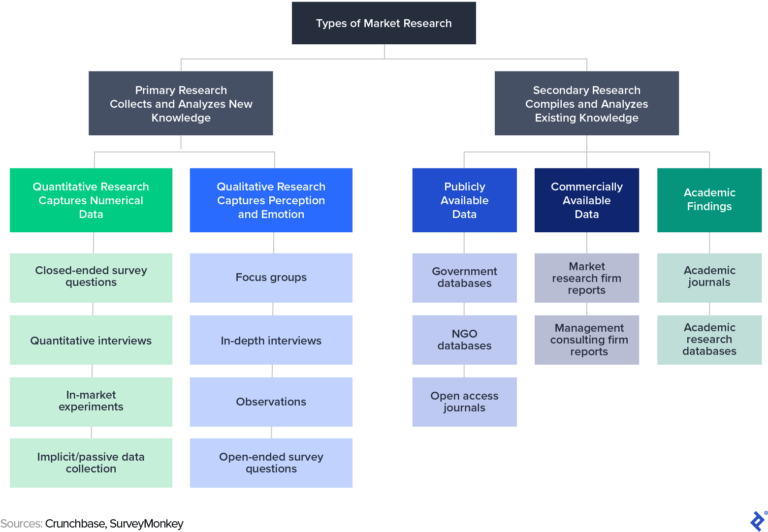
Market Research
-
Pricing
-
Sales pipeline
Concentrating your efforts on these three pillars can help you build the foundation necessary to scale, and develop the metrics that will convince investors to invest.
You can do market research by studying your customers and industry
Market research is the first thing you need to do to maximise revenue and create a solid foundation for your data strategy. By obtaining a thorough understanding of the target market, founders can establish a framework based on facts to project sales and profits through useful comparison data. You can use the intelligence that you gather to help determine the largest market you should target and also help develop pricing strategies, among other financial metrics.
Market research, even the simplest kind, can yield powerful results when a business is trying to determine its target customer. The surveys of potential customers provide both quantitative and qualitative data. I use these extensively in electronic questionnaires or remote interviews. Interviewing current employees, customers, and vendors in-depth can give you qualitative insight that can be used to help shape your company’s strategy. Focus groups are something I avoid because I don’t find it easy to run them impartially.
Market research has also helped me produce quantitaive statistics, which are included in many pitch decks. These can be used to improve operations such as lowering the acquisition cost. As an example, I helped a young automated manufacturing firm design and run a survey with its established customers in the industry. This survey collected a wide range of qualitative and quantitative information, including headcount, revenue, and industry challenges.
Incentivize survey participants by providing anonymized copies to show them how they compare with companies within their sector. We were able, using the information we collected to define key business variables for our client:
This data was used to help the company obtain $25 million in funding from a venture capital fund. The investment paid off: Since then, it has developed Fortune 500 clients and navigated a path towards becoming a leader in its field.
Price to Create Value and Capture Fair Share
In order to maximise sales, the second pillar of a startup’s metrics strategy involves adopting the most profitable and sustainable pricing mechanisms. I have noticed, however, that very few entrepreneurs explore all the pricing options available.
It can be difficult to determine the right price. You can lose clients if you charge too much. If you charge too little, your fundraiser goals will be undermined and money left on the table. You can find the right balance.
You need to first understand the fundamentals of pricing:
- Cost plus pricing: Calculate the price of your service or product and add a reasonable profit margin.
- Competitor pricing : Setting your prices based on the price that competitors, or possible competitors charge
- Pneumation pricing : Undercutting the competition at first by offering a lower price than industry standards to gain customers.
- Pricing based on value: Market research is used to determine the price your customers will pay for your service or product.
Although each pricing approach is beneficial, I think that 90 percent of startups are better off using value-based prices. Madhavan Ramanujam, a pricing expert, says that companies can expect to recover between 20% and 25% of their total value created for clients. It creates a balance that is sustainable between the bottom line of your business and customer benefit.
This framework will help you determine the ideal price for your service or product. Each step is illustrated with an example.
-
Calculate the value of your service or product in terms of dollars for clients.
What is the time and effort savings? How much money could they make using the product?- Sample Corp. widgets are likely to result in a sale of $A for Buyers Unlimited.
-
Calculate the percentage of success your clients have using your product compared to not using it.
- Sample Corp. widgets are worth $B to Buyers Unlimited. Sample Corp. widgets will be worth $B to Buyers Unlimited if they are X% less than Y%.
-
If you want to know your price, multiply the two numbers by 20 percent or 25 percent.
- Sample Corp. will earn $B between 20% and 25% if it provides widgets to Buys Unlimited.
Let’s use an example to illustrate the formula. Buyer’s Unlimited will be 15 percentage points more inclined to sell $100,000 per year if they purchase widgets from Sample Corp. The widgets would be worth $15,000 or 15% of $100,000 to Buyers Limited. You can then get a price for $15,000 by adding 25% to it. This gives you $3,750 as a high and a price of $3,000 as a low.
The higher your ROI, or return on investment, is, the more you can charge.
It is just as crucial to charge the correct price as it is to charge the customer in the best way.
There will be a standard business model for many new startups in tech, and especially within the startup sector. Your company may want to compete against social networks or search engines by offering the services for free. You will make money through advertising. You would adopt the same model as other streaming services if you were developing a service. This means offering a free version and then hoping that customers will upgrade to a paid subscription. It’s the same for models that cater to businesses, such as software-as-a-service, where the pricing is based around subscription services and tiers according to the number of customers.
It’s certainly possible to take a different path than your competition, but the truth is, it becomes more challenging to break away from the norm the more crowded an industry is. Don’t ignore the potential of a disrupting pricing strategy to differentiate yourself in a competitive field.
You can still increase your revenue by aligning with the industry standards. This is done through demand pricing, price tiers and other special fees. As an example, I was working with a client who built his business on managing healthcare clinics. Our pricing plan included consulting fees to advise on opening new clinics and profit sharing for financing. It also covered fees for specific clinic services.
Track conversions and sales with the Sales Pipeline
In the final and third pillar I recommend that startups maximize their revenue projections by defining and improving metrics for customer acquisition and sale. It is important to create the best possible sales pipeline. Sales pipelines allow founders, managers, salespeople, and investors visualize how customers move through the various stages of a sales cycle. You can forecast revenue by estimating how likely it is that potential customers will convert to customers.
The conversion data can be very useful from a tactical and operations perspective. This data allows you to project the number of new leads that you will need to create over a specific time period to achieve your annual revenue targets.
A spreadsheet can be used to build a pipeline for sales, but I would recommend investing in CRM, which is a system that manages customer relationships. A CRM, at its most basic, is a software application that provides a variety of tools for managing customer relations and tracking interactions, such as phone calls, presentations and other engagements. It is a central repository of information about customers and prospects. This is important because your business can store data about relationships, and organize it internally. These capabilities will give you more features than spreadsheets. I like to call a CRM a 3-D view, while spreadsheets can only be 2D.
Salesforce is one of many providers that cater to large enterprises. HubSpot is a budget-friendly platform with an entry-level price that’s popular among growth-oriented companies.
After the CRM has been implemented, it is possible to translate data about potential customers into your pipeline. The application can be used to provide insights on operations such as the sales pipeline velocity or conversion rates per stage.
These data can be used for estimating customer acquisition costs and lifetime values, and can help you have a more informed conversation with your team regarding sourcing and customizing a strategy to acquire customers.
Recent experience working for a marketing start-up in its early stages is helpful. The founder was an excellent salesperson but the CRM system of the company had a rudimentary design. It consisted of a basic sales log and contact details on another application. I uploaded all of this data to HubSpot as my first step. We were then able to customise it to fit the founder’s unique sales cycle, and develop a pipeline of sales that would give her an accurate view of her client relationship funnel. It allowed her to more accurately and efficiently calculate revenue forecasts.
Remember that to customize your sales pipeline, each stage must reflect a clearly-defined process. This includes initial contacts, referrals, diligence, presentations, proposals, negotiation, and results. Then you can assign different conversion probabilities for each stage, or each deal. The CRM will often do this automatically. However, I adjust the estimate based on historical data. Also, I try to estimate conservatively. The odds of conversion will increase as you progress through each stage.
Adopting a flexible CRM and creating a pipeline is essential for investors to be impressed by your annual revenue forecast. It is worth investing time to create defensible metrics for two reasons: the first being the data strategy that will be established and the second, the potential fundraising. My early-stage clients are told to expect to spend around 200 hours in this process. The first 100 will be spent on maximizing their revenue forecast, and producing other key performance metrics. And the second 100 will be networking with investors and giving pitches. This is a big investment in time and money, but I’ve found that it can increase the chances of being funded by up to five times.
It is possible to do quantitative forecasting even without having a solid financial background. If you invest the time and effort up front, not only will you improve your fundraising chances, but you’ll also be able to position your company for future growth.
Advanced Financial Modeling: Best Practices and Hacks to Intelligent, Error Free Modeling